Stephen P. Hammack and Joe C. Paschal
Download the PDF | Email for Questions
National Sire Evaluation | National Cattle Evaluation | EPD Traits | Interpreting EPD | Accuracy | Possible Change | Genetic Potential | Does EPD Work? | Using EPD
When evaluating prospective breeding animals, it is helpful to have an estimate of their genetic transmitting potential. For most production traits, this estimate is best calculated using records of performance.
The first performance records of beef cattle were primarily weights or weight gains measured at weaning or as yearlings. Sound comparisons of individuals were often impossible because of animal and management differences. Standard adjustments were developed for calf age, sex, and age of dam, but there were no good ways to adjust for differences in management, nutrition, location, season, and year. So the comparisons had to be limited to animals managed alike in a contemporary group.
To facilitate comparisons, ratios were sometimes calculated for individual animal performance within a contemporary group; however, these ratios still contained unaccounted-for differences between groups.
Progress in genetic evaluation came with Estimated Breeding Value (EBV), which used ratios calculated within a contemporary group. EBV added an animal’s own records to those of relatives and progeny. It also incorporated heritability, the average part of the difference in a trait derived from transmittable genetic content, which is not the same for all traits.
However, EBV still consisted mostly of within-group records. Because this limitation was often ignored, faulty comparisons were sometimes made of EBVs from different groups or herds.
National Sire Evaluation
More improvement in genetic evaluation came with Expected Progeny Difference (EPD). The term expected can be misleading as it implies a high degree of certainty, which may or may not be true. Predicted or estimated would probably be better terms than expected.
As was true for EBV, the basis of EPD is ratios within a contemporary group, but EPD has more scope and precision. With EPD, more valid comparisons can be made of animals across contemporary groups, not just within a single group.
The first practical implementation of EPD came through National Sire Evaluation (NSE), conducted by some breed registry associations. The widespread use of popular bulls through artificial insemination, particularly in breeds first available in the United States in the late 1960s, allowed them to serve as so-called Reference Sires, the benchmark in NSE. The first National Sire Summary, comparing EPDs of 13 bulls, was published by one of those breeds in 1971.
The only bulls that could be included in NSE were those with adequate numbers of progeny managed in contemporary groups where at least one Reference Sire was represented. Some often incorrect assumptions reduced the validity of the estimates. One of these assumptions was that bulls are not genetically related. Another was that bulls are mated to females of equal genetic merit. It was assumed that no progeny are culled before all records are collected and that breed averages for traits do not change over time.
National Cattle Evaluation
Refined mathematical techniques and expanded computing capacity made possible the next step in genetic prediction, National Cattle Evaluation (NCE). This evaluation compares animals within a breed more accurately than does NSE. All major breed associations have such programs. Using NCE, breed-association EPD programs include:
- Data from the individual, relatives, and progeny
- An adjustment for differences in genetic merit of mates
- Genetic correlation between traits
- Adjustments for genetic change over time and genetic relationships among individuals
- Adjustments for differences between contemporary groups in environment and management, such as climate and nutrition
- The requirement by some associations for Total Herd Reporting, which provides records on more individuals
- No more Reference Sires, because any individual with progeny in more than one contemporary group is, in effect, a reference
- EPDs that are directly comparable within a breed for all individuals (males and females) in all locations and management systems across all years
EPD Traits
All of the breed associations that have EPD report four traits:
- Birth Weight — in pounds at birth, excluding maternal influence. Birth weight is the most important factor in Direct Calving Ease (see below).
- Weaning Weight — in pounds at 205 days of age, excluding maternal influence (evaluated as Milk below)
- Yearling Weight — in pounds at 365 days of age, excluding maternal influence
- Milk — expressed as pounds of weaning weight (not pounds of milk) due to maternal influence of an individual’s daughters, excluding genetics for growth to weaning (evaluated as Weaning Weight above). The use of “milk” is inexact because this is an estimate of all maternal influences on weaning weight, milk production being the major element. Total Maternal EPD, combining Milk and Weaning Weight, also is reported by some breeds. Total Maternal should be ignored and the two components considered separately unless a producer merely wishes to increase weaning weight without regard for what causes the increase.
Other traits that may be included by a breed are:
- Direct Calving Ease — in percentage of unassisted births or as a ratio. This is an estimate of a calf’s ease of birth, excluding maternal factors (evaluated as Maternal Calving Ease below). Direct Calving Ease depends primarily on the size of the calf. If Direct Calving Ease is available, it should be emphasized instead of Birth Weight, which only indirectly estimates calving ease.
- Maternal Calving Ease — in percentage of unassisted births or a ratio. It is the ease of calving of daughters excluding factors associated with the calf (evaluated as Direct Calving Ease above). This essentially involves the size, internal structure, uterine environment, and other factors of the calving female.
- Calving Ease Total Maternal — combines Direct and Maternal Calving Ease
- Gestation Length — in days; is related to birth weight, calving ease, and calving interval
- Yearling Height — in inches, another estimate of genetic size; a predictor, along with weight traits, of mature body size
- Scrotal Circumference (SC) — in centimeters; a predictor of mass of sperm-producing tissue. Also, SC is positively related to younger age at puberty in males and their female relatives.
- Days to Finish — in days; the length of time needed to reach a set amount of fat cover
- Carcass Weight — in pounds, another measure of body size that is highly related to yearling weight
- Marbling — in USDA marbling degrees, the primary factor in USDA Quality Grade
- Tenderness — in pounds of shear force; a mechanical estimate of tenderness
- Ribeye Area — in square inches between the 12th and 13th rib; a predictor of total amount of muscle. Ribeye area is highly related to carcass and yearling weights.
- Fat Thickness — in inches over the ribeye at the 12th/13th rib; a predictor of total carcass fat which is the most important factor in percentage red-meat yield (cutability)
- Yield Grade — in USDA Yield Grade units; a measure of cutability
- Retail Product (RP) — in percent; another measure of cutability
- Ultrasound measures — for Ribeye Area, Ribeye Fat Thickness, Rump Fat Thickness, Retail Product, and Ribeye IMF (intramuscular fat, in percent), which is a predictor of marbling
- Mature Daughter Weight and Height — in pounds and inches; measures of mature size of daughters
- Cow Energy Indexes — in dollars or units of energy; assess differences in cow nutritional energy requirements
- Docility — in percentage of deviation from the probability of Behavior Score being either docile or restless as opposed to being nervous, aggressive, or very aggressive.
- Heifer Pregnancy — in percent; the pregnancy rate of daughters when exposed to calve first at 2 years of age
- Stayability — in percentage deviation from a 50 percent probability of daughters remaining in the herd to at least 6 years of age. This involves all factors in culling of females, and so is thought to be related to structural soundness, fleshing ability, reproductive efficiency, and general fitness.
- Value Indexes — in dollars, also called economic selection indexes and $ indexes; multi-trait indexes combining relevant production EPDs with cost to produce and value of product. Various breed associations have indexes for value: 1) as weaned calves, 2) after feeding, 3) as carcasses marketed on a Quality Grade-Yield Grade price “grid”, 4) with combined feeding and carcass value, and 5) for the total production cycle from conception to carcass.
Interpreting EPD
 EPD values are calculated as average relative deviations, not actual levels, of the unit of measurement of the trait. Assume that one bull has a Birth Weight EPD of +4.2 and another bull of the same breed has -1.4. This means that, if used on genetically equal females managed under equal conditions, the first bull is predicted to sire calves averaging 5.6 pounds heavier at birth (the difference between +4.2 and -1.4).
As another example, if one bull has a Weaning Weight EPD of +42 and another has +27, the predicted average difference between the two bulls is 15 pounds in weight of their calves at weaning.
EPD does not predict performance level. If a bull has +4 Birth Weight, this does not predict that he would increase birth weights by 4 pounds, nor would a bull with -1 Birth Weight decrease birth weights by 1 pound. The two bulls are predicted to sire calves averaging 5 pounds difference. The actual average birth weights, depending on other factors, might be 75 pounds and 70 pounds or 95 pounds and 90 pounds or any other average difference of 5 pounds. EPD predicts comparative differences, not level of performance.
If the EPDs of both parents are known, they can be combined to predict the relative performance of the progeny. For example, compare a sire of Weaning Weight +55 mated to a dam of +35 with a sire of +40 mated to a dam of +30. Their progeny would be predicted to differ in weaning weight by 20 pounds (55 + 35 minus 40 + 30).
Breed associations calculate their own EPDs that are comparable only within the breed. However, EPDs of individuals of the same breed can be legitimately compared even if they are to be mated to another breed, or cross of breeds, as long as the proposed mates are the same. For example, the EPDs of two Charolais bulls can be compared for use in a herd of Brahman-cross females.
There are some adjustment factors for comparing EPDs from different breeds, but they may be less reliable than within-breed EPDs. In most cases, producers should first determine which breed(s) to use and then decide which individuals to select from within the breed(s). To assist in choosing applicable breeds, see the publication in this series E-190, Texas Adapted Genetic Strategies for Beef Cattle V: Type and Breed Characteristics and Uses. All breed associations establish a base period when the breed-average EPD value for a trait is zero, and those bases differ for each breed. Selection changes genetic level over time. As time passes since the base was established, the breed average could differ increasingly from zero.
Breed averages can vary considerably. For example, recent average Yearling Weight EPD in one breed is +11 and is +76 in another breed. These breed averages cannot be compared, so the values do not mean that the second breed averages 65 pounds heavier.
Current breed averages can be used to see where an individual ranks within a breed. Maintaining a fixed base provides a benchmark that can be used to help determine the level of EPD in a breed that might be appropriate for particular production conditions. This benchmark would not be available if the breed average was reset to zero every time EPDs are recalculated.
Once or twice a year, associations update individual animal EPDs, breed averages, distribution of EPDs within the breed, and genetic trends. The most recent reports should be used and EPDs from different reports cannot be compared.
Accuracy
Suppose two individuals have Weaning Weight EPDs of +32 (0.62) and +46 (0.41). The values in parentheses are for Accuracy, which ranges between 0 and 1. (Accuracy usually is not calculated for Pedigree EPD, based only on parental EPDs, or for Interim EPD, based on pedigree EPDs plus the individual’s record.) Accuracy is influenced by the number of records, genetic relationship among individuals providing the records, heritability of the trait, and number of contemporary comparison groups.
Accuracy is not related to variation in progeny. Progeny of low-Accuracy parents will vary no more, on average, than progeny of high-Accuracy parents. Also, difference in parental EPD is not related to progeny EPD variation. For example, consider a sire and dam both with Yearling Weight EPD of +60 compared to a sire with +80 and a dam with +40. On average, there is no difference in progeny variation from these two matings and both sets of progeny are predicted to average +60 EPD.
So what is more important, the magnitude of EPD or Accuracy? EPD is an estimate of true breeding value in relation to other individuals in a breed. Accuracy is a measure of confidence that the EPD is the true breeding value. If a producer wants large and rapid change in a trait then EPD should be stressed, even if Accuracy is low. But if predictability is more important, higher Accuracy individuals should be selected. Regardless of Accuracy, EPD is the best estimate available of true breeding value.
Possible Change
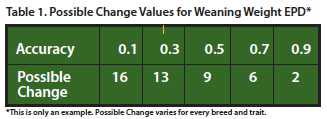
Over time, Accuracy increases and EPD often changes as more records relating to an individual (primarily progeny) are accumulated. Breed associations publish and regularly update Possible Change Values, which are measures of the average amount that EPD could change over time.
 For a given Accuracy, about two-thirds of the time an individual should have a true progeny difference within the range of the EPD plus and minus the Possible Change Value. But about one-third of the time, the true value could fall outside that range. Therefore, “Possible Change” is another misleading term because it implies incorrectly that greater change is not possible. However, for any range of Possible Change the true progeny difference is much more likely to be toward the center of the range than the extremes.
From this table, with Accuracy of 0.3, the Possible Change is ± 13 units of the EPD. So, for example,
with an EPD of +30 about two-thirds of individuals are expected to have true progeny differences between +17 and +43 (30 ± 13), sometimes called the confidence range. With Accuracy of 0.7 the Possible Change is only ± 6, so with EPD of +30 the true progeny difference is expected to be between +24 and +36. Note in the table that Accuracy of 0.9 predicts almost no change in EPD, but Accuracy this high is possible only for individuals with hundreds of progeny records. In short, higher Accuracy means greater predictability.
The anticipated direction of any future change is unrelated to the magnitude of the current EPD. That is, a numerically high EPD is as likely to change to an even higher value as it is to move downward. And a low EPD is as likely to change to an even lower value as it is to move upward. These considerations are taken into account in the calculations.
Genetic Potential
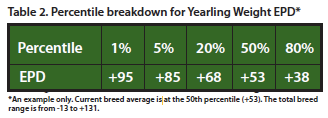
How much potential is there for genetic change within a breed? A good estimate can be obtained from a percentile breakdown, which shows distribution of EPD. Table 2 shows a percentile breakdown for Yearling Weight EPD and also lists the total range within the breed. With this information, a producer can determine potential for genetic change and also see where the EPD of a particular individual stands in the breed.
 This table shows an example of the EPD level for various percentiles. Based on the upper end of the range (+131), it would be possible to find a bull with EPD 78 pounds (131 minus 53) above breed average. However, only 1 percent of the individuals in the breed have EPDs of +95 or higher. Finding a bull just 30 pounds above average would require restricting selection to the top 5 percent of the breed. Broadening to the top 20 percent of bulls reduces the difference to just 15 pounds above average.
Although the range of genetic expression in a breed may be wide, the majority of EPDs will be near the average. But this means a producer who wants a performance level for a particular trait that is near breed average has large numbers of potential sires available. In that case, it is easier to find sires acceptable in all traits important in the herd.
Making a lot of change quickly in several traits requires unusual outlying sires. For example, a search in a breed with over 2,300 sires listed found only four in the top 10 percent for low Birth Weight EPD, high Weaning Weight EPD, and high Milk EPD. And those four sires might be undesirable in other important traits. The fastest genetic change can be made by using superior sires from a breed noted for high expression of the trait of interest. However, other changes would probably accompany a substitution of breeds. Considering the number of factors that should be considered in sire selection, only small change may be feasible in any one trait in a short time. The fastest genetic change can be made by using superior sires from a breed noted for high expression of the trait of interest. However, other changes would probably accompany a substitution of breeds. Considering the number of factors that should be considered in sire selection, only small change may be feasible in any one trait in a short time.
Does EPD Work?
What evidence is there to confirm the theory of EPD? A recent summary reviewed research results. The first part of the study compared sire EPD with actual performance of progeny. Nine studies of growth traits involved 27 trait analyses. In 23 instances, progeny response was higher from high-EPD sires than for low-EPD sires. Five maternal studies had 14 trait analyses, of which 13 resulted in higher response from cows whose sires had high EPD for maternal traits. And four carcass studies included 23 trait analyses; in 16 of these the response was higher from high-EPD sires.
In the second part of the review, progeny response was regressed on what was predicted from sire EPD. For growth traits there was an average response of 1.03 pounds in progeny for each 1.00 pound of sire EPD. In maternal traits the response averaged 1.45 to 1.00. And for carcass traits the response averaged 1.04 to 1.00.
In conclusion, the review of available research confirmed that EPD is a valid and useful estimate of true breeding value for growth, maternal, and carcass traits.
Using EPD
Suppose four producers are looking for sires of a particular breed. All four producers have used sires of this breed before in their herd.
 Producer A has F1 Brahman-cross cows weighing 1,200 to 1,400 pounds in moderate body condition. Calves are often retained through the feeding phase. All replacement females are purchased.
- Producer B has a group of yearling heifers to breed. All calves will be sold at weaning. No replacement heifers will be saved.
- Producer C sells at weaning and wants to increase weaning weights but not cow size. Cows usually stay in good body condition without much supplementation. Replacement heifers are saved to go back into this herd.
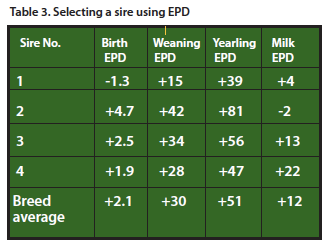
- Producer D saves heifers to go back into the herd and feeds out some calves. The producer is generally satisfied with current levels of calving ease, weaning weight, and postweaning performance. Potential sires are shown in Table 3. For reference, the current breed-average EPDs are shown. Which of these potential sires should be selected?
- Producer A would benefit most from growth potential, so long as carcass weights are not excessive. Milking ability is irrelevant, since replacements are not saved. With large Brahman-cross cows, calving difficulty (predicted from Birth Weight EPD) is of little concern. Therefore, the best choice is probably Sire 2, which is highest in Weaning and Yearling Weight EPDs.
- Producer B should give primary consideration to calving ease. Sire 1, with the lowest Birth Weight EPD, is the best choice for that purpose. Although Sire 1 is lowest in Weaning and Yearling Weight EPDs, in this case growth potential is secondary to calving ease. And no replacement heifers are saved, so Milk EPD is not a factor.
- Producer C, to increase weaning weight but not cow size, appears to need increased milk production in heifers going back in the herd. The body condition of the herd indicates that higher milking ability can probably be supported on existing production conditions. Sire 4, highest in Milk EPD and around breed average in Birth, Weaning, and Yearling Weight EPDs, is probably the best choice.
- Producer D does not seem to need significant change in any of these traits. Sire 3 is near breed average in Birth Weight and Milk EPDs and a little above average in Weaning and Yearling Weight EPDs. This is probably the best choice for this producer.
The best choice depends on the particular herd and what is needed from the sire. Many other production traits are important besides the four discussed above that are common to all breeds reporting EPD. Where EPD is available for other important traits, it should be the primary selection criterion for that trait. For traits without EPD, other valid measures of comparison should be used.
Production conditions and markets dictate appropriate levels of animal performance. For example, where forage is sparse or low in quality, mature cow size or milking potential may need to be moderated. Producers with experience using particular breeds in their production conditions have a better idea of appropriate levels of EPD within those breeds.
Summary
EPDs can be directly compared for all animals (male and female), from all locations and management conditions, across all years, within an entire breed. For the traits where available, EPD is the most accurate estimator of true breeding value.
